A student sits at his desk, fretting. The clock is ticking, the deadline is looming, and the giant mound of data he desperately needs processed remains, stubbornly and unabashedly, unaltered. He’s tried many things, but it’s only him and his workstation against the monstrosity of information he’s attempting to subdue. His PC, by itself, is by no means powerful enough to consume and transform all of this data into the meaningful conclusion he desires. Is there a hero in the ranks of software solutions that can help prevent this student from being devastated by the realization that large amounts of data can be hard to tame?
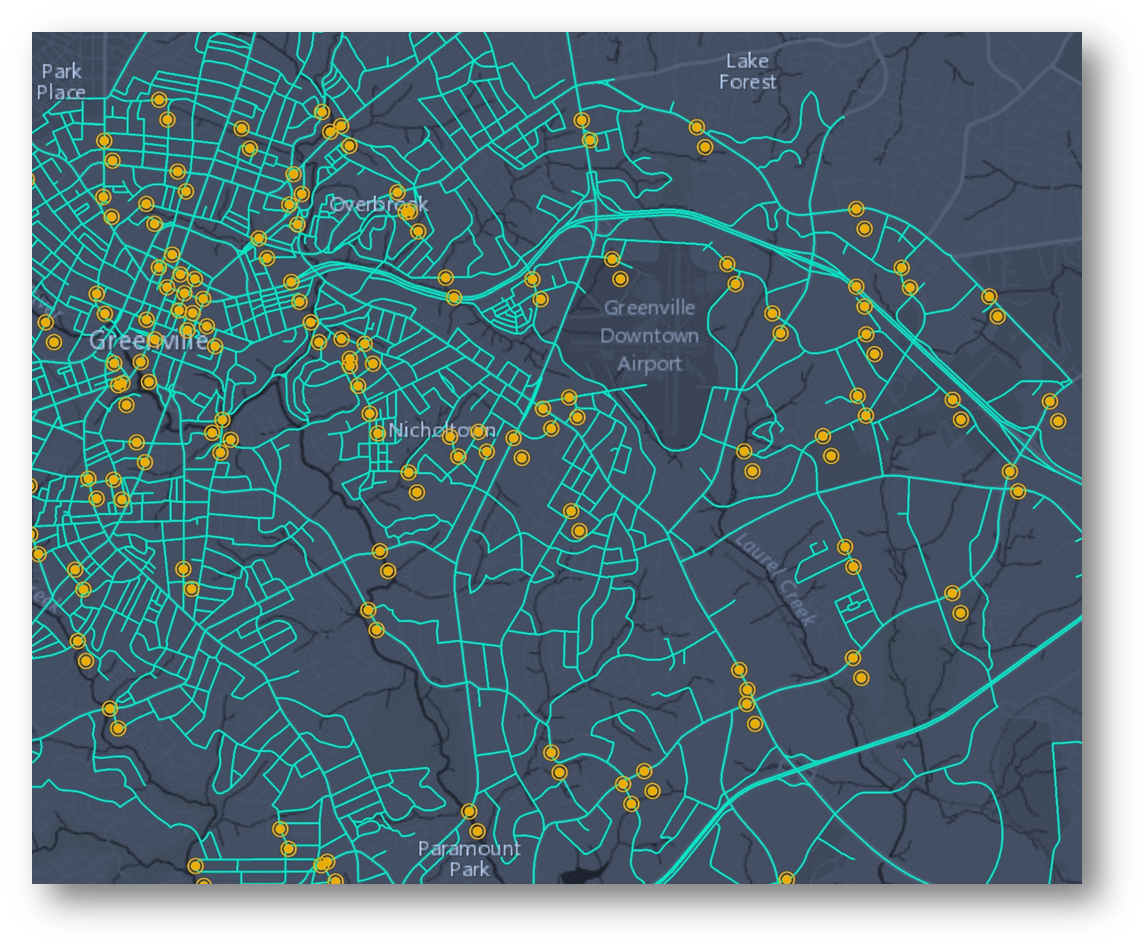
Of course, I’m being overly dramatic in my description of this dilemma, but recently, the Clemson Center for Geospatial Technologies (CCGT) team was able to help a student drastically reduce the amount of time it took to process a large amount of GIS (Geographic Information System) data. The student’s project consisted of creating new ways to calculate the Annual Average Daily Traffic (AADT) on roadways throughout Greenville, South Carolina. One of the steps involved in this project was calculating all possible intersects between analyzed traffic routes (1.9 million observations) and all the traffic data collection sites that are spread throughout the city of Greenville. When the student tried using their own machine to calculate the intersects the GIS software would munch on the dataset for a couple of days, and then the program would crash.
The CCGT team felt that this problem presented a perfect opportunity to use our advance cyberinfrastructure that utilizes a scheduler called HTCondor. HTCondor (or Condor for short) was developed at the University of Wisconsin. The software allows you to set up a distributed computing environment among other PCs within a network. You can connect as many PCs as you want or have available. This is called a Condor pool. This Condor pool allows for concurrent processing of multiple datasets which can reduce the amount of time it takes to process all of your data.
As an example analogy, imagine the amount of time it would take for you to eat an entire uncut pizza as fast as you can. If you try to eat it all by yourself the time it would take couldn’t qualify as very fast or efficient. Also, for one person to eat that much would put a strain on their body. Chances are you would get sick before ever finishing the entire pizza. Now, let’s say you cut up the pizza into 8 slices and invite 7 other people to join you. Each person would also eat a slice of pizza at the same time as you. The time it would take for the entire pizza to be consumed would be the time for one person, granted, the slowest person, to eat a single slice of pizza. Also, the strain on everyone’s body from eating just one piece of pizza would be minimal.
In order to help the student with their problem, by using Condor, we took a three-step approach:
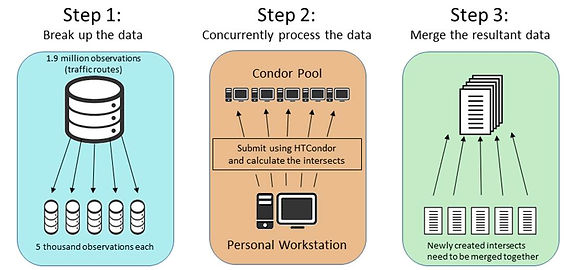
1. Break up the large 1.9 million entry dataset of roadways into smaller chunks of 5,000 roads each. This added up to 395 individual road datasets.
2. Submit each separate dataset through Condor to be processed separately and concurrently to calculate the intersection of each road with each collection site.
3. Merge all those observations back into one large dataset.
The Diagram below gives a visual representation of this process:

Preparing the data for Condor in the first step took the longest amount of time at approximately 1.5 hours to split the entire road network into 395 different files. In the second step, the time it took to process each dataset was between 15 and 20 minutes. If we were to calculate the time it would take to process all 395 datasets serially, without using Condor, the total amount of time would be approximately 395 multiplied by 15 minutes which adds up to 5,925 minutes or 4.11 days. Who has time for that? With Condor, the total time it took to process all the data added up to approximately 30 minutes. Finally, merging all the resultant data back together took approximately 1 hour. The grand total of time it took to produce the results the student needed was… 3 hours!!
When I look at the results of using Condor to process this big GIS dataset I am amazed at how efficiently and quickly we achieved our goal. Condor was the hero for this problem, but it also seems obvious that Condor is a perfect mold for many different areas of science and many other types of data, not just GIS. Condor is not the only solution to tackling these types of problems either. With Clemson’s own High Performance Computing cluster, Palmetto, available to all students, faculty, and staff many large problems can be solved with amazing technological solutions that are available to us right now. We just have to know how to access and utilize them.
One of CCGT’s main goals is to assist those that want to learn how to use available technology to help further their research. They accomplish this by presenting workshops and offering aid to those that might have a problem when it comes to managing, processing, and organizing their data.
If you’re curious about all the different types of workshops CCGT offers please feel free to send an email to CCGT if you’d like more information.
Patrick Claflin
GIS Sys Admin/Developer
Clemson University (CCGT)
